What’s new in version 20.2?
What’s new in version 20.2?
Dividend Matrix
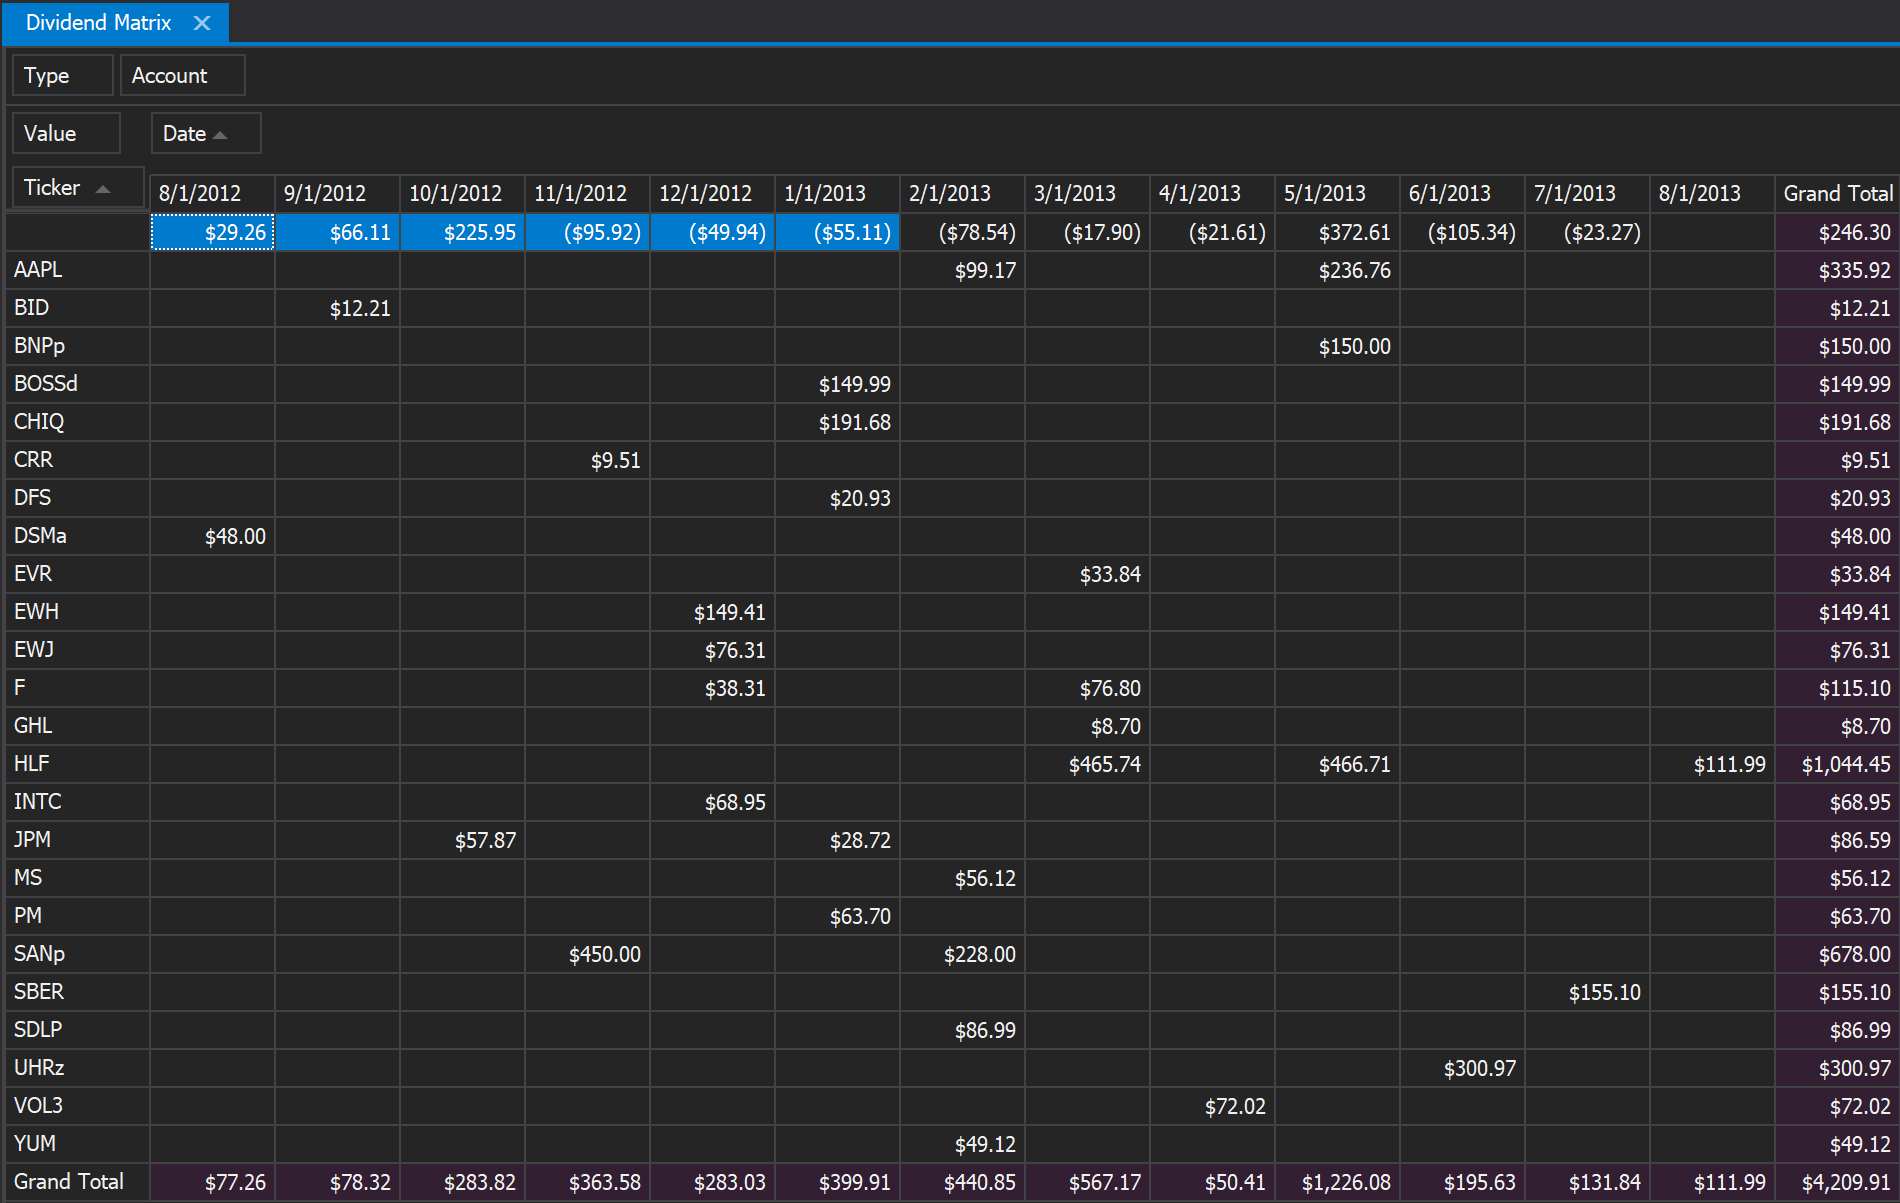
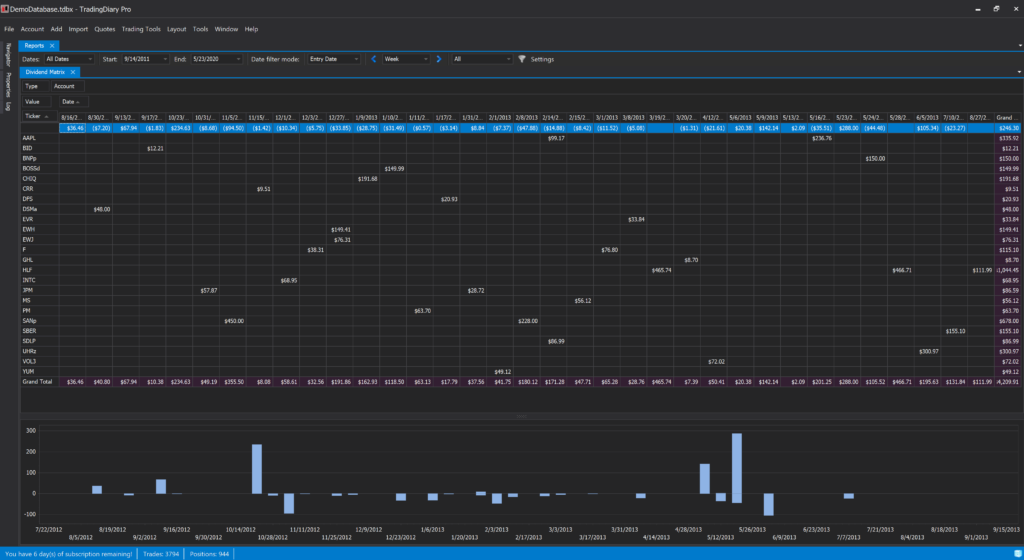
A new dividend report has been added which plots the dividends and withholding taxes on a pivot grid. The rows are the tickers, the columns are the dates and the summary field is the dividend (withholding tax) value.

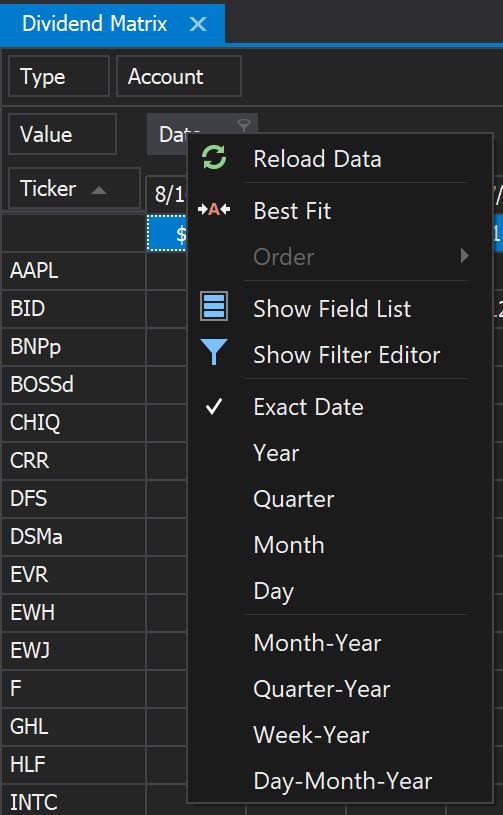
The Dividend Matrix has the same functionality as the Pivot Report. You can move the Type and Account columns into the Row or Column header area. Its worth mentioning that by right clicking on the Date box the date range can be changed to he followings: Exact Date, Year, Quater, Month, Day, Month-Year, Quater-Year, Week-Year and Day-Month-Year.

Minor changes
- Several performance improvements
- Equity gain or loss report handles transfers properly
- Added transfers section to the performance report
- Tastyworks Position excel file load to get EOD values for open positions
Import Modules
- Alight import module